Virgin Media Speeds In Nottingham
Category : How-to
Somewhat off-topic today, but something that I’ve recorded here to showcase the current state and see if anyone else is getting similar issues.
A colleague of mine and I have been measuring our broadband speeds since the start of the year. We both live in Nottingham and pay for a residential Virgin Media 200mbps line which I pay approximately £45 each month.
Given the data logged, we’ve concluded that our upload is typically fine at 12mbps but the download varies massively – to the point where single session streaming from Youtube/Netflix is unusable.
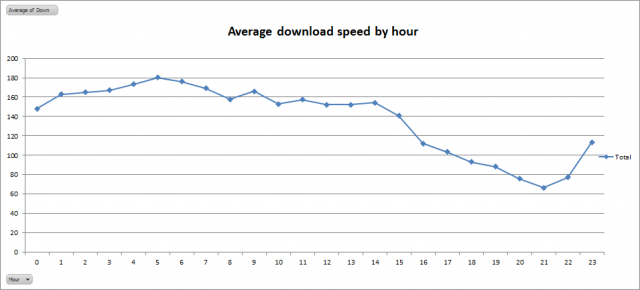
This graph shows average download speed per hour which clearly shows the drop during the ‘busy period’
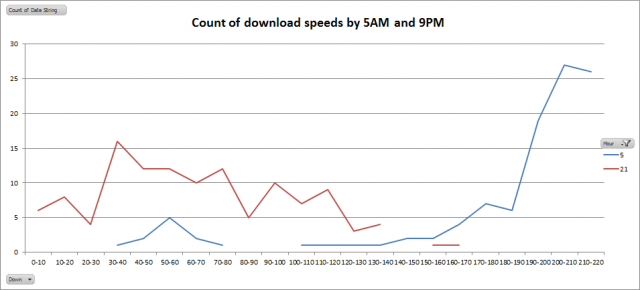
This next one shows the number of counts recorded at a given speed range for the best time (5am) and worse time (9pm). As you can see at 9pm I mostly get between 30mbps and 80mbps
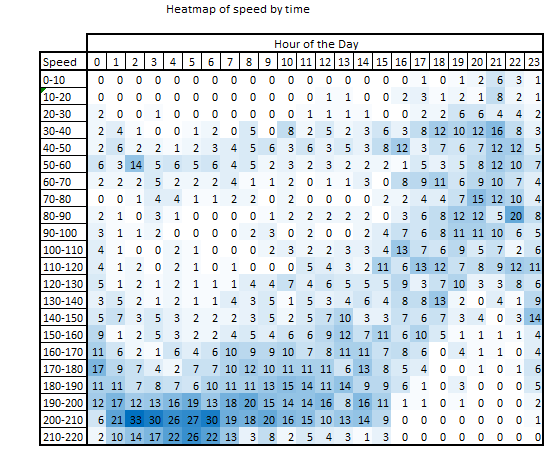
Another way to look at this is via a heatmap showing counts for all speed groups by hour:
We then wondered what the cost implication of this could be, if we only paid for what we got. The table below shows calculations of the cost impact. It is based on cost per month divided by 24 (number of hours) then working out the modified hourly rate based on that percentage.
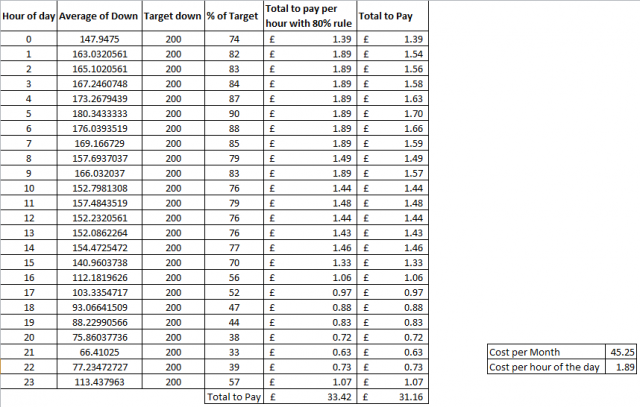
Being fair, I would ignore speeds where the fluctuation is less than 20% and pay the full price for that hour. An 80% drop in speed is perfectly reasonable in my book and something that probably wouldn’t be noticed by most people. Using the above calculation the result would be a cost of £33.42, meaning I’m overcharged by ~35%.
These are average speeds, and as shown above the download speed can be much lower than this average and it’s at these points the impact to me is most interruptive to me and this cost isn’t reflected above.
How are other peoples download speeds stacking up?
2 Comments
Robin Moffatt
3-May-2017 at 9:41 amHow are you measuring it? I’d like to repeat the same experiment here :)
I’m also on the same package from Virgin, up near Leeds.
That first chart (average) would be interesting plotted as min/max/median too to see the variance.
Cheers, Robin.
james.coyle
3-May-2017 at 9:52 amJust cron a speed test and log it to a file. Then Grep out the numbers (will post the grep shortly).
https://www.jamescoyle.net/how-to/1150-test-internet-speed-from-the-command-line
Min and max don’t show anything meaningful as you can’t be sure it’s not a one-off because you’re downloading, or the utility didn’t choose the best server, etc. It’s the pattern that gives more insight into what speeds you’re actually getting.