Author Archives: James Coyle

Windows Task Manager – what do the memory columns mean?

Get Social!

Screen Shot 2013-10-02 at 18.40.41

I have recently been using Windows to tune a Java application I created to move large amounts of data into a database. The application was very memory hungry as it implemented various queues to buffer incoming data before committing it to the data target.

This meant that I needed to understand the memory which was being used at any given point, both in the JVM and on the operating system itself. On the Windows side, the Task Manager has many extra columns which can be added to the Processes tab to see exactly what each process is doing, and how much resource it is costing to do it.

The CPU and IO columns should be fairly straight forward however the memory columns can be most confusing. Before we can get into it there are a few terms which you must understand

  • Physical memory – this is RAM, physical memory which you have installed in your machine. This is the fastest type of memory and also the most expensive. Physical memory will be used for all your processes memory requirements unless you run out or the operating systems decides to free some for other things.
  • Virtual memory – when you run out of physical memory and another process asks for more memory the operating system needs a mechanism to ensure the requirements can be met. Virtual memory is used much the same as RAM however it is stored on a disk. Disks, even SSDs, are very slow compared to RAM and come with a huge performance impact. Your operating system will move RAM to virtual memory when a process hasn’t been used for a while, or if sacrifices need to be made to free some RAM for something else.

There are many memory related columns in Windows Task Manager which all have subtly different meanings. Here are some of the most common and useful memory column definitions:

  • Memory – Working Set – is the total amount of memory used by the process which is private and unique to the process as well as shared memory used by the process such as shared libraries.
  • Memory – Private Working Set – is the amount of memory used by the process which is unique to the process and cannot be accessed by other processes.
  • Memory – Peak Working Set – is the most memory, both unique and shared, which has been used by the process since it started. This is reset each time the process ends.
  • Memory – Commit Size – is the amount of virtual memory which is reserved, or committed, for the process.
  • Page Faults – is the amount of times memory has been fetched from virtual memory because it was not found in physical memory. This is a counter and similar to Memory – Peak Working Set  in that it is reset each time the process ends.

By understanding an monitoring these values you can get an understanding of what a processes is doing with it’s memory.


OpenNode – the Proxmox alternative

Tags :

Category : Tech News

Get Social!

open-node
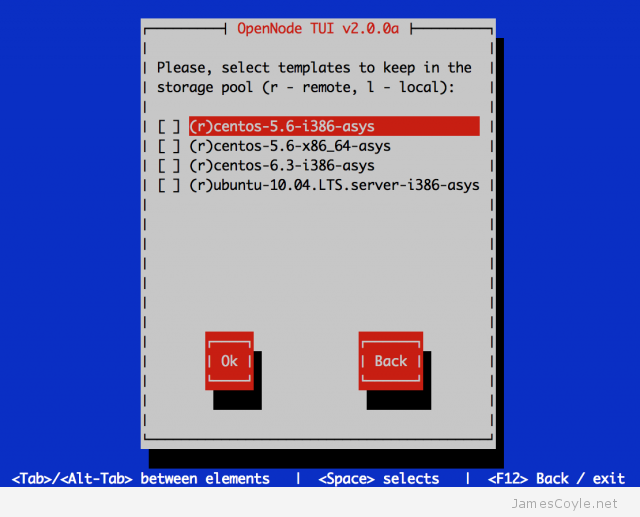
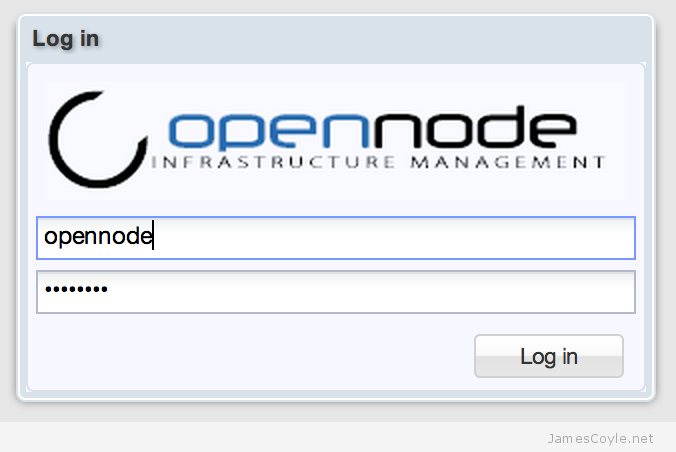
Over the past few days I have been looking at alternative virtualisation servers to Proxmox VE, something which I have been using for the past few years. This has been prompted by Proxmox’ recent move to subscription based stable repositories and free test repositories. What this means is that unless I pay a subscription, I am no longer allowed to use the stable Proxmox binaries through apt-get and have to use potentially unsafe ‘test’ binaries. Of cause, I could build the latest stable binaries directly from git but then there is another problem – I don’t know what commit is marked as ‘stable’ to use as my build source.

The trouble is, Proxmox is very good and has been around for quite a while under constant development. This means that it is feature rich, supporting two virtualisation methods (OpenVZ and KVM), has native support for many storage backends and has a nice web-based GUI to control it all. Other offerings are plentiful but none do quite the same job as Proxmox.

OpenNode is the closest I can find which is an immature version of Proxmox based on CentOS. It has support for both OpenVZ and KVM as well as a web GUI to administer it. It is a much younger product so don’t expect the same functionality as Proxmox but it’s showing promise and has an active and growing user base.

OpenNode has a few extras, compared with Proxmox, such as a SSH based GUI for downloading and maintaining VM templates (OpenVZ and KVM), adding storage locations and creating new VMs. The command is called opennode and starts a shell based GUI which you can move through with TAB and arrow keys.

Opennode TUI

Main menu in the TUI, the shell based administration tool.

Opennode TUI download kvm template

The KVM template download screen above is quite limited, however the are more up-to-date options for OpenVZ templates.opennode-login-screen

The web based GUI is hosted on a running OpenVZ container which, using the TUI tool, is registered with the OpenNode system. You can download and register the web based GUI using the TUI utility from the command line.

After logging in with the following:

  • username = opennode
  • password = changeme

You will be presented with the home page – I have nothing running at the moment as you can see from the below screen.

opennode web gui

As I said previously, this is still a little immature compared with Proxmox – it’s not as feature rich or as polished. That said, it looks after OpenVZ and KVM VMs and makes it very easy to add new templates and edit and create your own. The most understated attribute is the web Terminal – it doesn’t require Java and works like a charm! Combine that with no annoying ‘No valid subscription’ popups and OpenNode is looking more and more appealing.

So… should you ditch Proxmox and make the switch? I’m not sure, but be damn sure to give it a trial.


Proxmox OpenVZ SWAP and Performance

Get Social!

openvz-logo-150px_new_3 I have been having trouble with a Proxmox node which is only running OpenVZ containers however it is at the upper limit of its RAM resources. Over time, I noticed that Proxmox used SWAP (virtual memory, page file, etc), quite aggressively, to make sure there was always some RAM free. That sounds fantastic, and is just what I would expect the Proxmox server to be doing, except it does it all too well. Proxmox made sure that around 40% of the RAM on the host machine was free at the expense of moving many running processes across all the running containers to SWAP. This is how Linux works, by design, and is expected behaviour. Running processes which have memory which hasn’t been touched in a while have their memory moved to SWAP. This allows other applications which need the memory right now to use it and anything left over can be used as cache by the kernel. When a process with memory in SWAP needs to use that memory, it needs to be read from SWAP and back into memory so that it can be used. There is a huge overhead with this process and will often be noticed when you use a container which has not been used in a while – at the start everything will be slow until all the required memory items have been read from SWAP and put back into RAM. To help with this situation we can do two things:

  • Make sure SWAP is always on a fast disk with plenty of free IO bandwidth. On a small installation, this should not be on the same disk as your container file systems. SSDs can also bring a huge performance benefit over conventional mechanical drives.
  • Reduce the amount of RAM which Proxmox keeps free by making the algorithm which moves memory to SWAP less aggressive.

Move SWAP to fast storage

Generally, and when installing Proxmox for the first time a SWAP partition will be created on your hard disk. By default, this will be the same partition as your Proxmox operating system and your container storage. On a slow mechanical disk, this will result in far too much IO concurrency – that is different processes trying to read or write to a disk at the same time – which will massively affect server performance. One thing we can move to another disk is system wide swap.

You can either use a new file, disk, partition or block device for your new swap location. You will then need to turn your old SWAP device off to stop it from being used. Use the below examples to move your SWAP device.

See this post for a quick script to automatically create a SWAP file.

Make a new SWAP device as a file

Create a file on your file system and enable it to be used as a SWAP device. The below example uses the mount /mnt/swapdrive and the file swapfile to use as your new swap device with a size of 4096 MB.

dd if=/dev/zero of=/mnt/swapdrive/swapfile bs=1M count=4096

You will then need to format the file as SWAP with the below command.

mkswap /mnt/swapdrive/swapfile

Make a new SWAP device as a partition

Use the below command to use a drive partition as your new SWAP device. The below example uses /dev/sdc3 as your SWAP partition. You must have precreated this partition for it to be available.

mkswap /dev/sdc3
swapon /dev/sdc3

Turn a new SWAP device on

Once you have a new SWAP device created, either a file or a disk or partition you will need to enable it. Use the swapon command. The below shows an example of a file and disk partition command:

swapon /mnt/swapdrive/swapfile
swapon /dev/sdc3

Turn off the old SWAP device

To turn off the old SWAP device, first identify it using swapon -s.

swapon -s

Then, use the swapoff command to turn the device off. The below example is the default Proxmox SWAP device location.

swapoff /dev/mapper/pve-swap

Clear SWAP space without rebooting

You can clear your SWAP memory by turning the system wide SWAP memory off and then back on again. Run the below commands to turn off your system wide SWAP space forcing all the SWAP to be read back into RAM. You must have enough RAM for available on your system for this to work correctly. Once this has completed, run the second command to turn SWAP back on again. You can also use this to make your SWAP memory changes take effect.

swapoff -a 
swapon -a

Make the SWAP file persist after rebooting

To make sure your SWAP file is mounted the next time your machine reboots you’ll need to add an entry to the fstab file.

Open the fstab file with your text editor:

vi /etc/fstab

And add a line, similar to the below making sure the first attribute is the location of your newly created SWAP file.

/mnt/swapdrive/swapfile  swap  swap  defaults  0  0

Change the ‘swapiness’ setting

To change how aggressively Proxmox, or other Linux distribution, moves process memory to SWAP we have a swapiness attribute. The swapiness setting is a kernel setting which is permanently set in the /etc/sysctl.conf file, or temporarily using sysctl.

The swapiness setting takes a value between 0 and 100. Using 0 will virtually turn off using SWAP, except to avoid an out of memory exception (oom). Using a value of 100 will cause the system to use SWAP as often as possible and will likely degrade system performance servilely. A value of 60 is the default for Proxmox.

Change the swapiness value for the current boot

To change your swapiness value for the current boot, use the below command. The value will be reset after rebooting. The following example will set the swapiness value to 20.

sysctl -w vm.swappiness=20

Permanently change the swapiness value

Use the below command to permanently change your swapiness value. Note that this will not affect the current boot.

vi  /etc/sysctl.conf

And add the following to give a swapiness of 20

vm.swappiness=20

My experience with GlusterFS performance.

Category : How-to

Get Social!

gluster-orange-ant
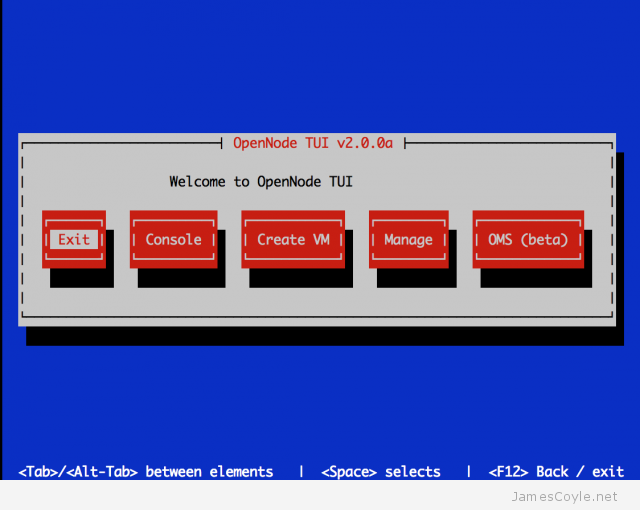
I have been using GlusterFS to replicate storage between two physical servers for two reasons; load balancing and data redundancy. I use this on top of a ZFS storage array as described in this post and the two technologies combined provide a fast and very redundant storage mechanism. At the ZFS layer, or other filesystem technology that you may use, there are several functions that we can leverage to provide fast performance. For ZFS specifically, we can add SSD disks for caching, and tweak memory settings to provide the most throughput possible on any given system. With GlusterFS we also have several ways to improve performance but before we look into those, we need to be sure that is it the GlusterFS layer which is causing the problem. For example, if your disks or network is slow, what chance does GlusterFS have of giving you good performance? You also need to understand how the individual components work under the load of your expected environment. The disks may work perfectly well when you use dd to create a huge file, but what about when lots of users create lots of files all at the same time? You can break down performance into three key areas:

  • Networking – the network between each GlusterFS instance.
  • Filesystem IO performance – the file system local to each GlusterFS instance.
  • GlusterFS – the actual GlusterFS process.

Networking Performance

Before testing the disk and file system, it’s a good idea to make sure that the network connection between the GlusterFS nodes is performing as you would expect. Test the network bandwidth between all GlusterFS boxes using Iperf. See the Iperf blog post for more information on benchmarking network performance. Remember to test the performance over a period of several hours to minimise the affect of host and network load. If you make any network changes, remember to test between each change to make sure it has had the desired effect.

Filesystem IO Performance

Once you have tested the network between all GlusterFS boxes, you should test the local disk speed on each machine. There are several ways to do this, but I find it’s best to keep it simple and use one of two options; DD or bonnie++. You must be sure to turn off any GlusterFS replication as it is just the disks and filesystem which we are trying to test here. Bonnie++ is a freely available IO benchmarking tool.  DD is a linux command line tool which can replicate data streams and copy files. See this blog post for information on benchmarking the files system.

Technology, Tuning and GlusterFS

Once we have made it certain in our minds that disk I/O and network bandwidth are not the issue, or more importantly understood what constraints they give you in your environment, you can tune everything else to maximise performance. In our case, we are trying to maximise GlusterFS replication performance over two nodes.

We can aim to achieve replication speeds nearing the speed of the the slowest performing speed; file system IO and network speeds.

See my blog post on GlusterFS performance tuning.


GlusterFS performance tuning

Category : How-to

Get Social!

gluster-orange-antI have been using GlusterFS to provide file synchronisation over two networked servers. As soon as the first file was replicated between the two nodes I wanted to understand the time it took for the file to be available on the second node. I’ll call this replication latency.

As discussed in my other blog posts, it is important to understand what the limitations are in the system without the GlusterFS layer. File system and network speed need to be understood so that we are not blaming high replication latency on GlusterFS when it’s slow because of other factors.

The next thing to note is that replication latency is affected by the type of file you are transferring between nodes. Many small files will result in lower transfer speeds, whereas very large files will reach the highest speeds. This is because there is a large overhead with each file replicated with GlusterFS meaning the larger the file the more the overhead is reduced when compared to transferring the actual file.

With all performance tuning, there are no magic values for these which work on all systems. The defaults in GlusterFS are configured at install time to provide best performance over mixed workloads. To squeeze performance out of GlusterFS, use an understanding of the below parameters and how them may be used in your setup.

After making a change, be sure to restart all GlusterFS processes and begin benchmarking the new values.

GlusterFS specific

GlusterFS volumes can be configured with multiple settings. These can be set on a volume using the below command substituting [VOLUME] for the volume to alter, [OPTION]  for the parameter name and [PARAMETER] for the parameter value.

gluster volume set [VOLUME] [OPTION] [PARAMETER]

Example:

gluster volume set myvolume performance.cache-size 1GB

Or you can add the parameter to the glusterfs.vol config file.

vi /etc/glusterfs/glusterfs.vol
  • performance.write-behind-window-size – the size in bytes to use for the per file write behind buffer. Default: 1MB.
  • performance.cache-refresh-timeout – the time in seconds a cached data file will be kept until data revalidation occurs. Default: 1 second.
  • performance.cache-size – the size in bytes to use for the read cache. Default: 32MB.
  • cluster.stripe-block-size – the size in bytes of the unit that will be read from or written to on the GlusterFS volume. Smaller values are better for smaller files and larger sizes for larger files. Default: 128KB.
  • performance.io-thread-count – is the maximum number of threads used for IO. Higher numbers improve concurrent IO operations, providing your disks can keep up. Default: 16.

Other Notes

When mounting your storage for the GlusterFS later, make sure it is configured for the type of workload you have.

  • When mounting your GlusterFS storage from a remote server to your local server, be sure to dissable direct-io as this will enable the kernel read ahead and file system cache. This will be sensible for most workloads where caching of files is beneficial.
  • When mounting the GlusterFS volume over NFS use noatime and nodiratime to remove the timestamps over NFS.

I haven’t been working with GlusterFS for long so I would be very interested in your thoughts on performance. Please leave a comment below.


Remove the Proxmox “No Valid Subscription” message

Category : How-to

Get Social!

proxmox logo gradProxmox 3.1 has implemented a new repository setup, as described in my recent blog post.

Each time you log into Proxmox 3.1 a dialogue box pops up with the message:

You do not have a valid subscription for this server. Please visit www.proxmox.com to get a list of available options.

One way to remove the message is to purchase a subscription from the Proxmox team. Remember that paying subscriptions keeps the development of Proxmox progressing. For the recent release, the subscription cost has been heavily reduced and is more affordable than ever.

The fact of the matter is, I started using Proxmox as a free and open source tool and expected it to stay that way. Had I known a subscription element would have been introduced, I would likely have chosen another toolset. As it is, I am too invested in Proxmox (time-wise) and changing to another technology is simply out of the question at this point. This brings me onto the other method; make a slight change to the code to remove the dialogue box from appearing. This is allowed under the License (aGPLv3) used for Proxmox however future updates may break your code and you may have to re-apply it or apply a different change.

You will need SSH access to the Proxmox host with the required access to edit the pvemanagerlib.js file.

First, take a backup of the file:

cp /usr/share/pve-manager/ext4/pvemanagerlib.js /usr/share/pve-manager/ext4/pvemanagerlib.js_BKP

Then open the file using a text editor, vi for example.

vi /usr/share/pve-manager/ext4/pvemanagerlib.js

Currently on line 519 of the file, however it may change with future updates, there is a line similar to below;

if (data.status !== 'Active') {

This line is doing the check to see if your subscription status is not ‘Active’. This needs to be changed to return false to stop the subscription message from being shown.

if (false) {

And that annoying little popup will be a thing of the past!

Note: You may need to clear your web browser cache after applying this code change.

I have added this code to my Proxmox patch – see this blog post for more information.


Visit our advertisers

Quick Poll

Which type of virtualisation do you use?
  • Add your answer

Visit our advertisers